

Top 10 Data Quality Tools: User Reviews and Pricing (Nov’25 Upd.)

November 7, 2025 - 20 min read

Author
For countless teams, data quality standards are not consistently met. It’s not because people don’t care, but because data quality rarely competes with urgent, day-to-day priorities. Without clear ownership and disciplined routines, data management often becomes the last priority.
Take a familiar example: CRM hygiene. Sales teams have to update records after each call, but if no one checks completeness and accuracy, often fields may stay. Over time this becomes normal. The noise adds up until an audit or a manager’s note triggers a rushed clean-up with half-reliable data.
AI raises the stakes. Chatbots and assistants are becoming the front end to an organisation’s information. When we no longer dig through source data and instead get answers from a chatbot, it’s easy to trust them by default. A misplaced decimal or a misspelled name in a CRM can quickly spread across dashboards, decisions, and even external communications.
Data-quality tools don’t fix the root cause of the problem, but they do reduce risk and rework. In this article, we’ll review the leading data quality tools, their strengths, best-fit use cases, limits, pricing, integrations, and opinions from real users.
What are Data Quality Tools?
Before we answer that, let’s briefly recall what “data quality” means. It’s typically assessed across six parameters:
- Accuracy: how closely data reflects reality.
- Completeness: whether all required records and fields are present when expected.
- Consistency: whether data remains the same across systems and time, within agreed tolerances.
- Uniqueness: whether records are free from duplicates.
- Validity: whether data conforms to defined business rules, formats, and constraints.
- Timeliness: whether data is available when needed, usually against agreed SLAs.
Data quality tools help you measure and improve these dimensions. Common capabilities include data validation, lineage tracking, anomaly detection, deduplication, schema and rule enforcement, and monitoring with alerts. Together, these features form a platform for managing data quality at scale.
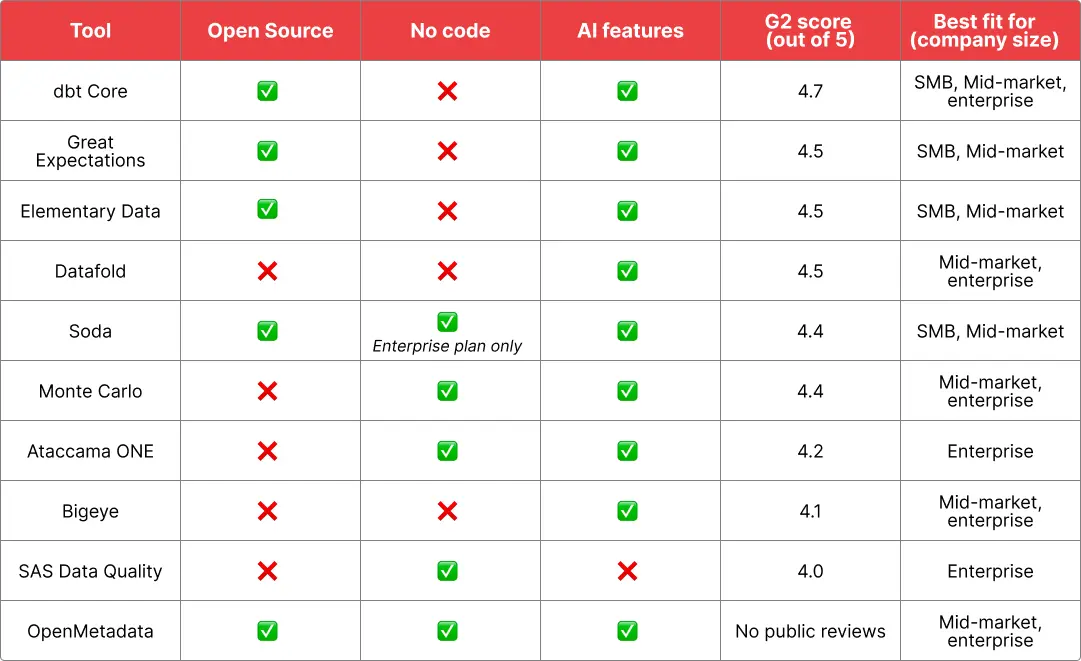
Top 10 Data Quality Tools
Now, let’s take a deep dive into each tool to compare their strengths and weaknesses and understand which one will be the best fit for your needs.
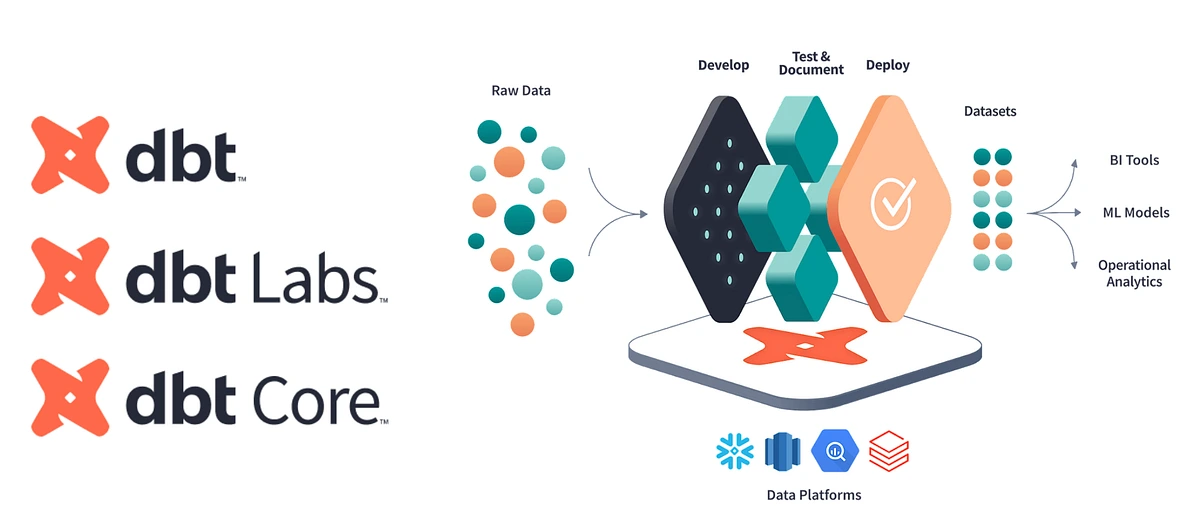
 dbt Core
dbt (data build tool) is an open-source framework that helps data teams build, test and document data transformations inside the data warehouse. The official docs describe dbt as an industry standard for analytics engineering that enables teams to avoid writing boilerplate SQL and instead define transformations as modular SQL SELECT statements.
dbt compiles these models and runs them against cloud data warehouses, letting analysts collaborate on a single source of truth while leveraging software‑engineering practices like version control, CI/CD and documentation.
The core product, dbt Core, is open source and installed via command line. dbt Labs also offers a managed SaaS (dbt Cloud) with a browser‑based IDE, job scheduler and enterprise features, but the underlying transformation engine remains the same.
Key strengths
- SQL-centric, modular transformations: dbt encourages writing transformations as plain SQL SELECT statements and compiles them into efficient queries, eliminating boilerplate DDL/DML code.
- Engineering rigor and reliability: By treating analytics code like software, dbt brings practices such as version control (Git), modularity and automated testing to the data warehouse.
- Built for the cloud: dbt is cloud-native and modular by design, allowing teams to execute transformations on their existing warehouse and collaborate on logic via shared code repositories.
- Extensible via packages and macros: The Jinja‑based templating system allows teams to create custom macros, materialisations and packages, enabling automation and reuse across projects. Community‑developed packages provide common patterns (e.g., dbt‑utils) and integrations with tools like Snowflake and Fivetran.
Ideal use case
dbt is best suited for analytics engineers and data teams who want to manage all transformations in the warehouse using SQL and software‑engineering best practices.
Organisations adopting modern ELT architecture, where extraction/loading is handled by tools like Fivetran or Airbyte and transformation happens post-load can benefit from dbt’s ability to orchestrate incremental models, run at scale in cloud warehouses and integrate with CI/CD pipelines.
Data and analytics teams with Git proficiency and a culture of code review will find dbt’s approach particularly useful.
Pricing model
dbt Core is free and open source.
For teams wanting a managed service, dbt Cloud offers four pricing plans:
- Developer: free; includes a 14‑day trial of the Starter plan, one developer seat, 3 000 successful models per month and one project; features include a browser‑based IDE, multi‑factor authentication (MFA), job scheduling and staying on the latest dbt release.
- Starter: $100 per user per month; provides five developer seats, 15 000 successful models per month, 5 000 queried metrics per month and one project. It adds basic dbt Catalog, basic Semantic Layer, Copilot code generation and API access.
- Enterprise: custom pricing; supports custom seat counts, 100 000 successful models per month, 20 000 queried metrics per month and up to 30 projects. It includes advanced Catalog, advanced Semantic Layer, dbt Copilot, dbt Canvas, dbt Insights, cost‑optimisation features, dbt Mesh and the ability to add analyst seats.
- Enterprise+: custom pricing; adds enterprise‑grade features like PrivateLink, IP restrictions, rollback and support for hybrid projects.
These prices apply only to dbt Cloud. Teams using dbt Core can avoid subscription fees but must manage infrastructure, orchestration and environments themselves.
Ecosystem and integrations
dbt has an extensive ecosystem. The website has 40+ integrations, including:
- Cloud data platforms
- Data movement platforms
- BI and analytics tools
- Operational analytics and reverse ETL tools
- Data quality tools
- Data catalogs
- Orchestration platforms
- Data monitoring tools
dbt’s semantic layer also provides GraphQL and JDBC/ADBC endpoints so any tool that speaks SQL or Arrow Flight can query the metrics.
Customer reviews and considerations
dbt enjoys an overall rating of 4.7 out of 5 on G2 (out of 187 reviews!), with about 86% of reviewers awarding five stars.
Positive sentiment:
Among things that customers admire the most are:
- Ease of use
- Powerful transformation capabilities
- Easy setup
- Rich integrations
Areas of concern:
As for the downsides, users admit that some error messages can be vague, making troubleshooting hard if something goes wrong. Besides, build time gets slower with larger models and the bottlenecks aren’t always obvious.
As for the cloud version, users on forums state that seat based prices on Enterprise plan might be too high: “The last customer I consulted for had some very serious qualms about paying 350 USD / month / seat, with a 3 year contract for enterprise, so they pulled the plug and moved back to DBT Core.”
Considering that OSS and Cloud versions are pretty much the same, it makes sense to go with the former if budget is a concern.
Verdict
dbt Core has become the de facto standard for managing analytical transformations in the cloud. Its SQL‑first approach, rigorous engineering practices and large ecosystem make it indispensable for teams seeking maintainable, version‑controlled data models. The open‑source core provides powerful capabilities without cost, while dbt Cloud offers convenience features and enterprise tooling at a price.
Prepare your data infrastructure with a scalable, dbt-driven transformation layer and CI guardrails. Book a data readiness consultation with Vodworks engineers.
Great Expectations
 Great Expectations (GX) is an open‑source data quality framework that has been around since 2017. The tool lets data teams define expectations, human‑readable assertions about what data should look like, and then validate data sets against these expectations
The core library, GX Core, is written in Python, integrates with popular data processing engines and databases (e.g., Pandas, Spark, SQL databases) and can generate rich HTML documentation of validation results.
Great Expectations recently added a SaaS offering, GX Cloud, that streamlines deployment and collaboration. This data quality tool offers profiling, continuous validation and monitoring, and claims that teams can start testing in minutes*.*
The tool is supported by an active community (≈13,000 members) and has become a reference point for open‑source data quality testing
Key Strengths
- Rich flexible expectations library: GX lets users define expressive expectations that reflect business logic and validate data where it lives, and it’s considered one of the most feature‑rich open‑source data quality frameworks. The framework can auto‑generate expectations using machine‑learning based “ExpectAI” and can run validations in batch or continuous modes
- Integration with profiling and documentation tools: GX integrates with Pandas Profiling to generate detailed data profiling reports that reveal distributions, missing values and correlations. Validation results can be rendered as HTML data‑docs, enabling stakeholders to understand data quality status.
- Extensive ecosystem: GX connects to many data sources (CSV/JSON files, Pandas and Spark dataframes, SQL databases and warehouses). It integrates with orchestration tools like Airflow, Prefect and dbt, and can push results to data catalogs (DataHub, OpenDataDiscovery) and ML pipelines (Kubeflow). It also sends notifications via your preferred communication tools (Slack, email, etc.).
- Open-source tool with an active community: The tool is open‑source and is powered by the community. The community has contributed connectors, custom expectations and knowledge sharing.
Ideal use case
Great Expectations shines in scenarios where teams need a code-based, version-controlled approach to data testing across different layers of a data pipeline.
This data quality tool is particularly good for batch-processing workflows in Python or SQL that run in orchestrators such as Airflow or Prefect.
Teams who maintain data contracts or shared data dictionaries will appreciate the human‑readable expectation definitions and the ability to generate HTML documentation of test results.
However, it’ll also be useful for organisations seeking a fully managed platform with collaborative dashboards and support because GX Cloud offers a SaaS solution.
Pricing Model
GX Core is open source and free to use.
The GX Cloud SaaS platform has tiered pricing. The “Developer” tier is free and is designed for individuals or small projects; it allows up to 5 validated data assets per month and up to 3 users.
The “Team” tier is a custom‑priced plan targeted at collaborative teams. It provides unlimited validated data assets, up to 10 users and offers features like unlimited expectations, unlimited validations, AI‑enabled recommendations, auditing/logging with one‑year retention and basic support.
The Enterprise tier is also custom‑priced and designed for large organisations. It adds enterprise‑grade features such as multiple workspaces, agent deployment, single sign‑on, extended auditing/logging (life‑of‑term retention), uptime SLA, dedicated Slack channel, severity‑based support SLAs and professional services (5 hours annually).
Ecosystem and integrations
The platform’s website has a collection of 22 data sources. It connects to BigQuery, Snowflake, S3, and many other data warehouses and database management systems.
In addition to that, the platform also connects to a few orchestration tools (including Airflow), communication platforms (Slack, Teams), and others.
Great Expectations also provides an API endpoint.
Customer reviews and considerations
G2 ratings give Great Expectations an overall 4.5 out of 5 score, with 81 % of reviewers giving it five stars.
Positive sentiment:
Ease of use is one of the advantages highlighted by most reviewers. Clients say that the platform is intuitive and allows them to focus on analysis and significantly enhances their data management capacity.
Besides, users value automated testing features, which can catch issues early in the workflow.
Areas of concern:
As for the negatives, reviewers claim that the platform has a difficult initial setup. Some also mention limited functionality in the OSS version for advanced use cases.
On the r/dataengineering subreddit, the sentiment towards Great Expectations is mixed. Users often claim that the tool is bloaty, has outdated documentation, and simply too cumbersome when you have to set it up for the first time.
Still, advanced users of this data quality tool claim it has immense potential, and the experience significantly improves once the challenging setup phase is complete.
Verdict
Great Expectations offers one of the most comprehensive open‑source frameworks for data quality testing.
Its rich library of expectations, extensive integration ecosystem and strong community make it a powerful choice for teams who need granular, version‑controlled data tests across diverse data sources.
Whether you’re looking for a code-based data quality tool, or a managed SaaS solution, it’s a comprehensive tool that definitely should be on your watchlist.
Elementary Data
Elementary Data is a data observability platform built around the dbt ecosystem. The company markets Elementary as a developer‑first data quality tool that lets teams monitor data pipelines in minutes and eliminate noise with AI‑powered detection.
Elementary comes in two versions:
- Elementary OSS** (open‑source CLI package):** a self‑maintained, open‑source command‑line tool that integrates with a dbt project. It runs anomaly detection and dbt tests, stores results in the team’s data warehouse and generates a self‑hosted HTML report that exposes test results, data lineage and test coverage. Users can self‑host and customise the package for free.
- Elementary Cloud: a fully managed, enterprise‑ready SaaS platform that provides the OSS features plus machine‑learning‑powered anomaly detection, integrated incident management, data dashboards and integrations.
Elementary is positioned as a cost‑effective alternative for dbt‑centric data stacks. It automates anomaly detection for volume, freshness and user‑defined metrics, stores dbt test results, provides column‑level lineage and integrates with alerting and collaboration tools.
Key strengths
- dbt-native integration: Elementary is designed specifically for dbt‑centric data pipelines and integrates into dbt workflows and pipelines. It plugs easily into dbt projects and compiles logs for insights.
- Comprehensive anomaly detection and testing: The platform provides out‑of‑the‑box monitors for freshness, volume and schema changes, while the cloud version adds ML‑powered anomaly detection and bulk test creation.
- Data lineage and impact analysis: Elementary delivers end‑to‑end, column‑level lineage up to business‑intelligence tools, helping teams understand downstream impacts and root causes.
- Open-source availability: The OSS CLI and dbt package are free to use and can be self‑hosted, giving teams a strong data quality tool free of charge.
Ideal use case
Elementary is ideal for analytics and data engineering teams that use dbt for transformation and want to add observability without infrastructure heavylifting.
OSS version suits teams that want a free, self‑hosted solution for monitoring dbt tests, while Elementary Cloud targets mid‑sised and enterprise organisations that need automated anomaly detection, incident management and collaboration across stakeholders.
For organisations seeking to involve business users, the cloud’s dashboards and AI‑driven recommendations enable non‑technical stakeholders to monitor data health.
Pricing model
Elementary offers a free open‑source package and tiered cloud subscription plans. The pricing model is based on seats, with unlimited monitored tables, tests and monitors
All plans include anomaly detection, dbt test integration and reporting:
- Starter: $650 per month. Up to 2 users, includes column‑level lineage, performance monitoring and unlimited monitored tables.
- Essentials: $1,600 per month. Everything in Starter plus up to 5 users, collaboration features, AI agents for automated triage/coverage/discovery/governance, incident management, end‑to‑end lineage and a dedicated Slack support channel.
- Enterprise: Custom pricing. Flexible seats, enterprise‑grade security and deployment options, integrations with data catalogs and ticketing systems, role‑based access, implementation and training sessions and premium support.
The OSS CLI is free and open source. It provides anomaly detection and dbt tests, basic alerts and table‑level lineage. Teams can self‑host the OSS package without licensing fees.
Ecosystem and integrations
Elementary integrates with many parts of the modern data stack. According to the documentation:
- Data warehouses: Snowflake, BigQuery, Redshift, Databricks, Postgres, Athena, Dremio and ClickHouse
- Transformation and orchestration: dbt Core, dbt Cloud, dbt Fusion (beta) and Apache Airflow.
- Data visualisation/BI: Tableau, Looker, Power BI, Sigma, ThoughtSpot, Hex, Metabase, Mode and Explo.
- Reverse ETL: Hightouch and Census.
- Code repositories:GitHub, GitLab, Bitbucket and Azure DevOps
- Alerting and incident management: Slack, Microsoft Teams, PagerDuty, Opsgenie, webhooks, Jira, Linear and ServiceNow
- Governance: integration with the Atlan data catalog.
- Iceberg catalog: integration with AWS Glue.
Customer reviews and considerations
G2 lists 18 verified reviews with an average score of 4.5 out of 5.
Positive sentiment
Reviewers praise the ease of setup and dbt-native approach. Many users like how quickly this data quality tool can be integrated into a project and efficiency of its batch configuration.
Besides, users mention that the Elementary team is very responsive, listens to feedback, and provides fast support through Slack.
Areas of concern
Users note that integration with additional BI platforms and ticketing systems is lacking, and the catalog solution is basic.
Some reviewers request better filtering and navigation in the UI to quickly focus on critical issues.
Finally, this data quality solution adds metadata via dbt hooks, which can slow down dbt workflows. This overhead might be significant for larger pipelines.
Verdict
Elementary Data offers a compelling dbt‑native data observability solution that balances an open‑source foundation with powerful cloud‑based enhancements. Customer feedback is overwhelmingly positive.
However, the main limitation is Elementary’s reliance on dbt. It makes it unsuitable for pipelines built without. Teams should evaluate their existing dbt adoption and integration requirements to determine whether Elementary aligns with their data quality strategy.
Add observability to your data stack. Vodworks engineers will handle lineage, monitors, and alerts without additional overheard for your main team. Book a consultation.
Datafold
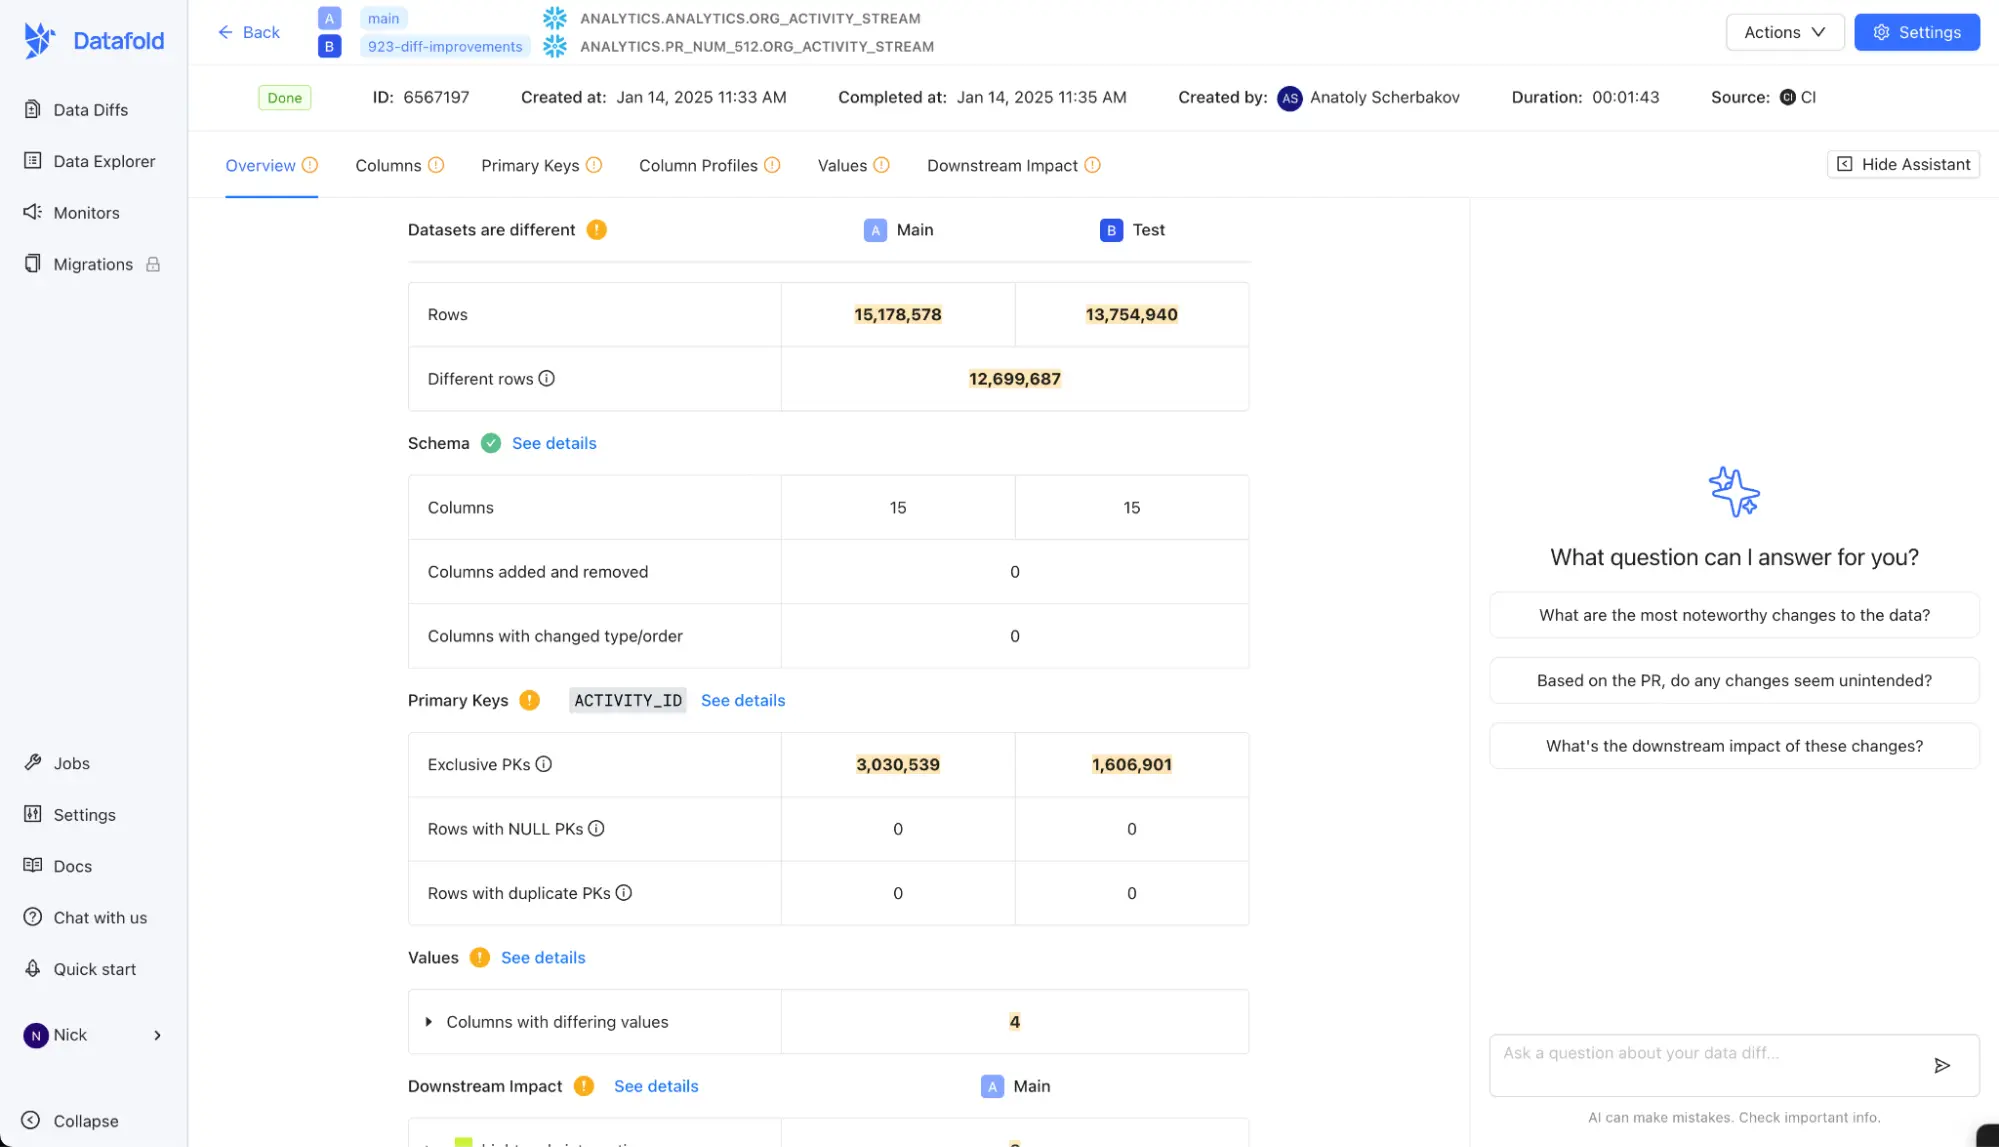 Datafold is a unified data observability data quality platform founded in 2020.
This data quality tool combines data‑testing, data reconciliation and observability to help engineering teams prevent data quality issues and speed up development. Datafold automates error‑prone parts of the data‑engineering workflow and integrates deeply with CI/CD, allowing teams to catch and fix problems before data hits production.
Besides automated testing, Datafold includes monitoring, profiling, column‑level lineage and other observability features.
The platform can be deployed as SaaS or within a private VPC and supports both SQL and NoSQL databases, including Snowflake, Databricks, BigQuery, Redshift, Oracle, SQL Server, Teradata and MongoDB
Key strengths
- Value‑level data diff engine: Datafold’s core innovation is a high‑performance diff engine that compares datasets within or across databases. The engine scales to billions of rows and provides value‑level precision for cross‑database diffing.
- Column‑level lineage & data explorer: Datafold maps relationships between individual fields across transformations and downstream BI assets.
- Migration acceleration: The Datafold Migration Agent uses AI to translate SQL dialects and validate migrations across databases.
Ideal use case
Datafold shines in analytics-engineering teams using dbt or SQL-based transformations. It lets developers run automated diffs as part of pull requests, shortening feedback loops and preventing breaking dashboards or models.
The platform also accelerates migrations from legacy warehouses to cloud platforms. Users report that Datafold helped them uncover case-sensitivity issues and untrimmed values during their migration, saving the team's time.
For organisations implementing data governance or change management processes Datafold provides detailed lineage for tables and BI assets to trace dependencies.
Pricing model
Datafold is a proprietary SaaS platform. Pricing is customised based on the number of users and the number of tables monitored and tested.
Teams can purchase the full platform or individual modules (e.g., migration conversion, column‑level lineage) separately. Deployment options include multi-tenant SaaS, single-tenant VPC, and customer-hosted VPC.
Recently, the company introduced a free tier to make core developer tools, such as Data Diff, available to smaller teams.
Pricing scales with developer seats, number of monitored tables, and usage metrics.
Ecosystem and integrations
According to the Datafold website, their data quality tool integrates with 39 technologies across the modern data stack. The list includes:
- Databases (MySQL, SQL Server, BigQuery, Redshift, etc.)
- BI tools (Tableau, Looker, Power BI, Mode)
- Transformation and orchestration platforms ( dbt Cloud, dbt Core, Jenkins, CircleCI, etc.)
- Version control tools (GitHub, GitLab, Bitbucket, Azure DevOps)
- Reverse ETL (Hightouch)
- Authentication and SSO (Google, Okta, SAML, Microsoft Entra ID)
- Alerting and communication ( Slack, PagerDuty, Microsoft Teams, email, webhooks)
Customer reviews and considerations
Datafold has a high satisfaction score on G2. The platform scores 4.5 out of 5 from 24 reviews, with 79% of reviewers giving it five stars.
Positive sentiment
Reviewers say Datafold detects errors and helps them accelerate data pipeline troubleshooting. Many appreciate that the tool provides immediate visibility into the impact of code changes and offers real‑time alerts.
Besides, users commend the ability to run value‑level diffs, integrate with GitHub, GitLab and CI pipelines, and schedule automated monitors.
Areas of concern
Some reviewers find the pre-built tests inflexible and note that Datafold takes time to learn.
A few users also note that Datafold’s integrations are not as extensive as those offered by competing tools.
Forum users and some client reviews expressed concerns about open-source reliability. Datafold sunset its open-source data-diff project, leaving diffing only in its SaaS platforms. Some users and contributors got upset because some had projects revolving around this tool while others have contributed work into this open source project which ended up archived.
Verdict
Datafold is a powerful data‑quality and observability platform that brings software‑engineering practices, such as diffing, testing and CI/CD, to data pipelines.
Datafold is best suited for engineering‑driven organisations willing to invest in automated data testing and who prioritise developer productivity over minimal cost. Smaller teams or those needing non‑SQL analytics may want to evaluate open‑source alternatives or less expensive observability suites before committing.
Soda Data Quality
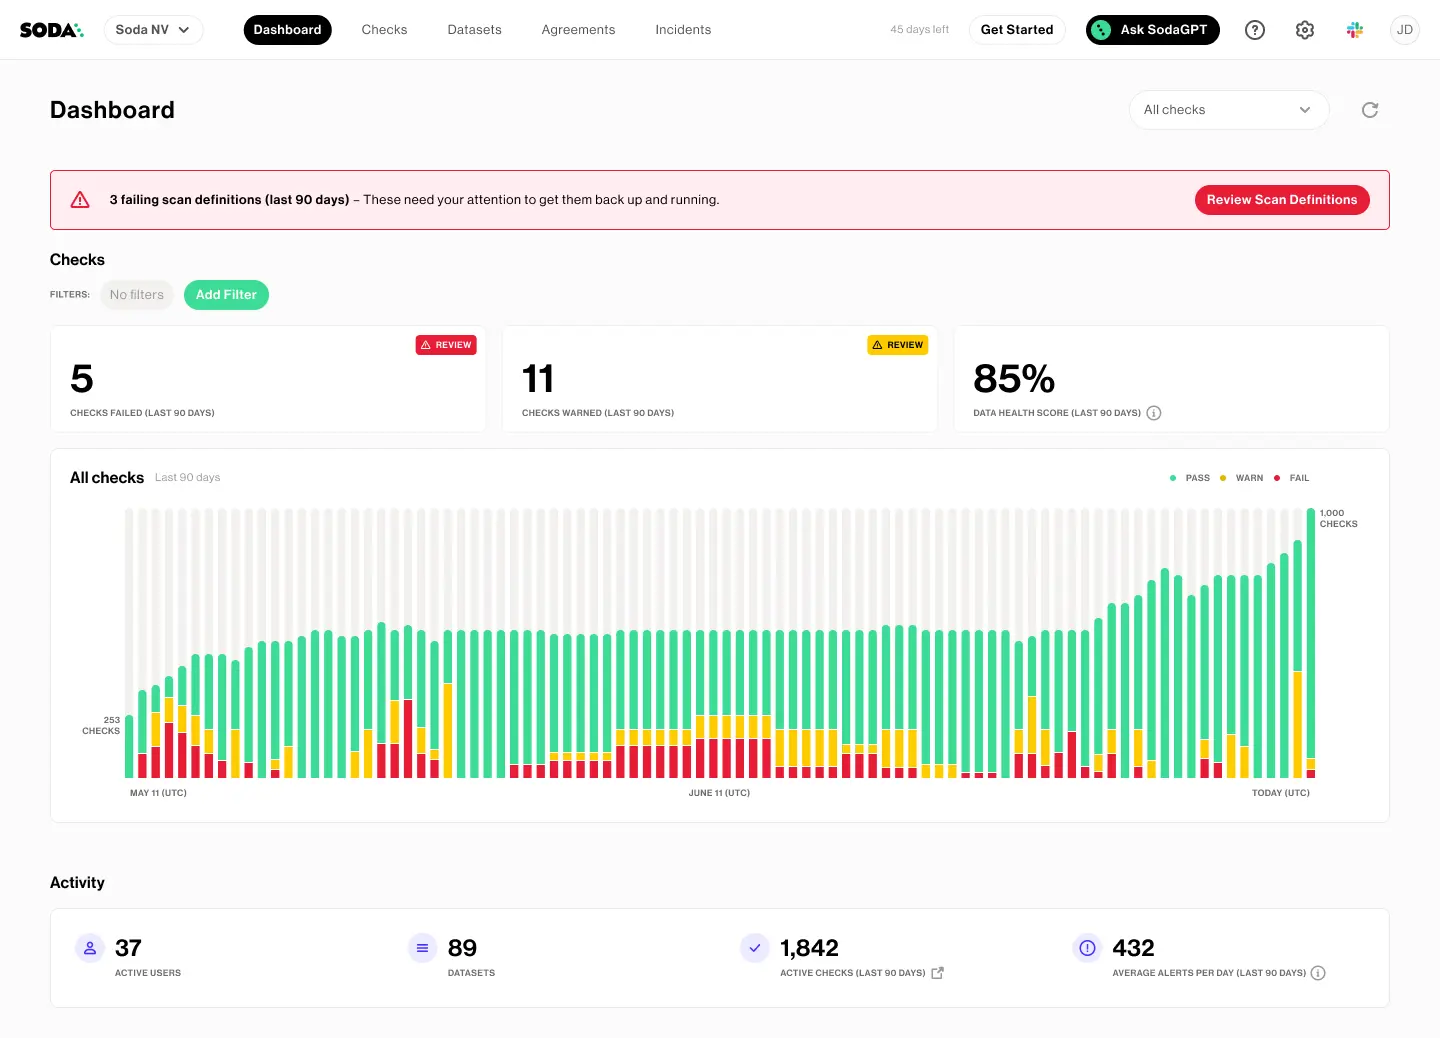 Soda is a data‑quality tool that aims to help teams test and deliver trustworthy data. The open‑source core (Soda Core) is a Python library and CLI that uses a declarative Soda Checks Language (SodaCL) to define quality tests as YAML files and run scans on datasets.
These checks can be embedded directly into CI/CD and data pipelines to detect missing values, duplicates, out‑of‑range numbers and other anomalies early.
On top of the core is a SaaS layer, Soda Cloud, which adds dashboards, anomaly detection, alerting and collaborative data contracts.
The platform therefore combines pipeline‑native validation, production monitoring and governance features in one data quality tool.
Key strengths
- Pipeline-native validation: Soda Core runs quality checks inside data pipelines, allowing teams to catch issues during ingestion, transformation or deploymentю
- Developer-friendly: Checks are defined in YAML using SodaCL, making rules readable, version‑controlled and Git‑native.
- Open-source: The Soda Core project on GitHub is licensed under Apache‑2.0. It is a free CLI/Python library for running checks.
- GenAI assistant: SodaGPT converts natural‑language requests into SodaCL code so non‑technical users can define tests. The platform is also experimenting with AI‑assisted anomaly detection
Ideal use case
Soda works best for engineering‑centric organisations that treat data like software. This data quality tool is ideal when you check data health inside the pipeline, domain owners manage their own rules and teams prefer CLI tools and configuration files over drag‑and‑drop interfaces
For companies already invested in dbt, Airflow or other orchestration tools, Soda’s checks integrate seamlessly into existing workflows.
Pricing model
Soda Core itself is open source and free to use, so teams can start testing data without cost and upgrade when collaboration, dashboards or AI features are needed.
Soda’s pricing page states that the company offers a Free Plan suitable for small projects, allowing up to three production datasets, pipeline testing, metrics observability and alerting integrations.
The Team plan is billed at $8 per dataset per month (prices billed annually) and includes everything from the free tier plus all integrations, unlimited users and a pay‑as‑you‑go model.
The Enterprise plan is custom‑priced and adds collaborative data contracts, a no‑code interface, AI‑powered features, audit logs, role‑based access control, private deployment, single sign‑on and premium support
Ecosystem and integrations
Soda positions itself as a “data‑quality platform for your whole company,” and integration is a core part of its strategy. The documentation lists connectors for:
- Data catalogues & governance – Alation, Atlan, Metaphor and Microsoft Purview allow users to surface Soda-driven quality metrics and rules inside catalogues, metadata and lineage diagrams.
- CI/CD & development tools – dbt and GitHub Actions integrate with Soda to ingest test results, execute scans on pull requests and maintain version‑controlled checks.
- Messaging & collaboration – Slack and Microsoft Teams channels receive alert notifications and provide spaces to collaborate on failed checks.
- Incident & ticketing systems – Jira and ServiceNow integrations automatically create tickets or incidents when checks fail. Webhooks allow connections to PagerDuty or custom endpoints.
These integrations, paired with the open‑source engine, make Soda flexible for different environments and allow data quality signals to appear where teams already work.
Customer reviews and considerations
On G2, Soda scores 4.4 out of 5 with 67% five‑star ratings.
Positive sentiment:
Reviewers value the tool’s:
- Strong data quality results
- Easy-to-use integrations
- Customisability
- Clean and intuitive UI
However, some users wish for more machine‑learning‑based tests, noting that paid offerings could be more automated.
Areas of concern:
As for the limitations, users report some bugs and instabilities in certain parts of the software, not-so-straightforward data sampling and validation, and a room for improvement in the anomaly detection area.
r/engineering community describes Soda Core as a lean, nice tool but “somewhat limited.” A contributor noted that the Soda library offers more features such as dashboards, but it is tied to the cloud, meaning results must be hosted with the vendor.
Verdict
Soda delivers a developer‑centric approach to data quality. Its declarative checks, open‑source engine and broad integration ecosystem make it a compelling choice for teams that treat data like code and want tight control over validation.
However, Soda is not a complete observability platform. Organisations seeking automated profiling, lineage tracing or root‑cause analysis may find its capabilities limited.
For many engineering‑led organisations looking to codify expectations and embed tests in pipelines, Soda represents a powerful, pragmatic data quality framework; for those needing full‑stack observability or heavy automation, complementary tools or alternative platforms may be required.
Ship pipeline-native checks and governance. Vodworks can help you implement a Git-native, rules-based quality layer that scales. Schedule a consultation.
Monte Carlo
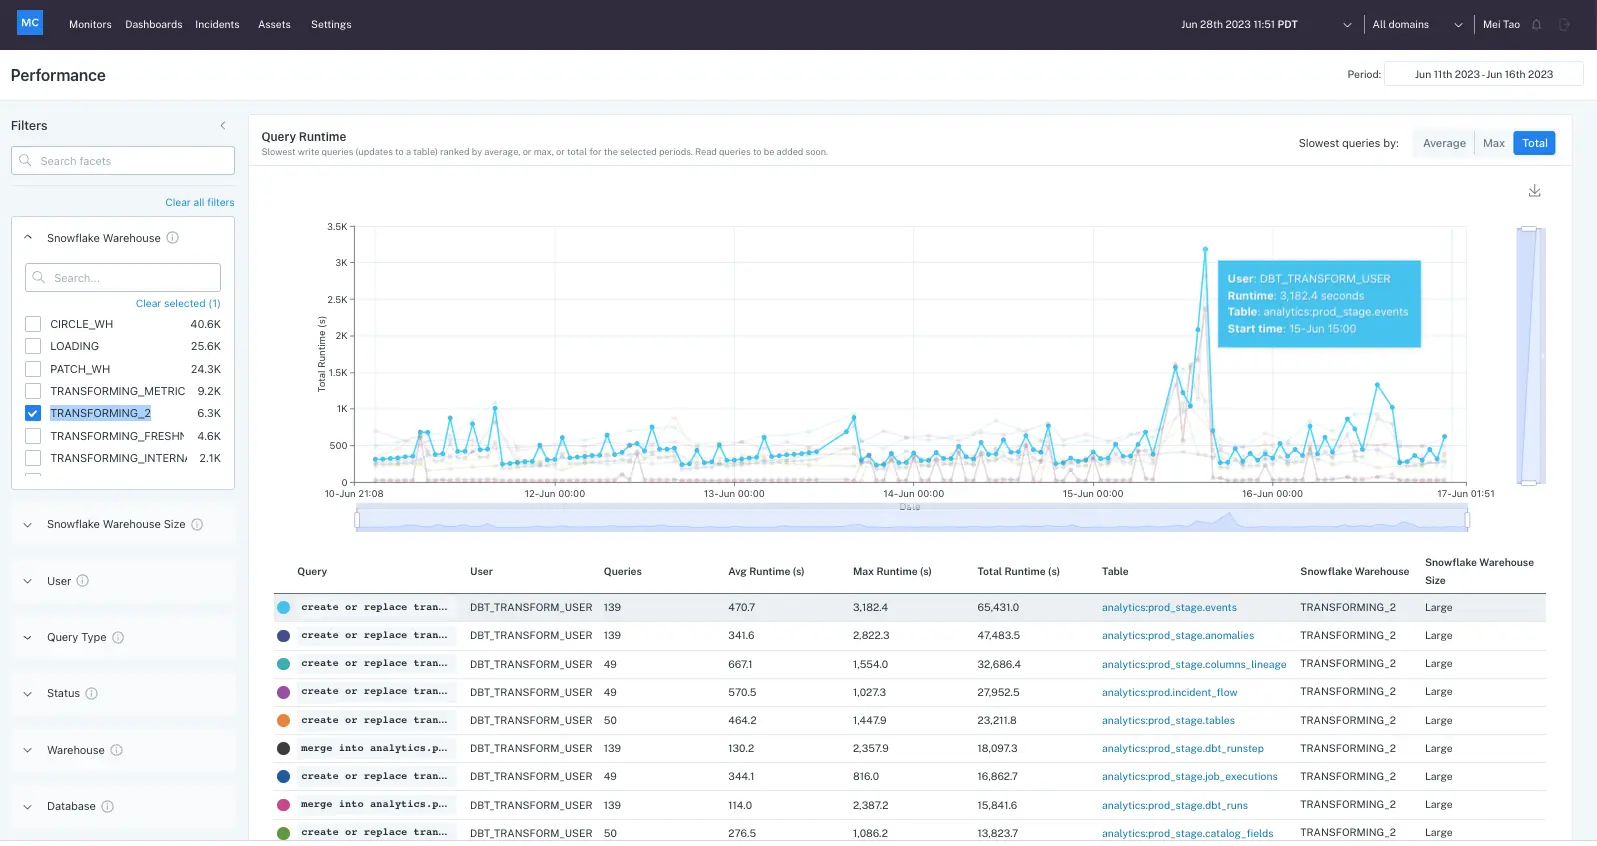 Monte Carlo is a commercial data quality tool and observability platform founded in 2019. The company positions its product as a “data + AI observability” platform, that enables enterprise organisations to detect and resolve data‑quality issues across data, systems, code and machine‑learning models.
The platform is popular in mid‑market and enterprise environments; G2 data shows that 47% of users come from mid‑sized organisations and 48% from large enterprises, with high adoption in industries such as financial services, IT and software.
Unlike many open source data quality tools in this article, Monte Carlo is proprietary software offered under a subscription model.
Key strengths
- Automated, AI-powered monitoring: The platform allows teams to create and deploy new monitors in seconds, easily discover the right monitors for each table, and autoscale coverage as the environment grows.
- Comprehensive observability: The platform provides end-to-end coverage from ingestion to consumption.
- Flexible deployment: Monitoring can be deployed via SQL, a codeless UI or programmatically. The data quality tool also allows for YAML‑based configurations during CI/CD or using a point‑and‑click interface.
Ideal use case
Monte Carlo is suited for firms that need continuous observability across a complex, modern data stack. Its automated monitoring and out‑of‑the‑box monitors make it particularly useful when data pipelines span multiple warehouses, lakes and BI tools.
It is often chosen for automated incident detection and root‑cause analysis, making it valuable where data downtime and delays in issue resolution have significant financial or operational impact.
Pricing model
Monte Carlo is closed‑source software; the company does not publish list prices. Instead, it offers usage‑based plans that scale with the number of monitors and API calls:
- Start: Designed for a single team up to 10 users; Pay-per-monitor pricing up to 1,000 monitors; 10,000 API calls per day. Includes monitoring for data warehouses, BI and ETL; incident triaging and root‑cause analysis; lineage and performance observability;
- Scale: Unlimited users; Unlimited monitors with a pay-per-monitor pricing; 50,000 API calls per day. Adds monitoring for data lakes and databases, data mesh support, automation (exports, webhooks), networking features.
- Enterprise: 100,000 API calls per day; Builds on Scale plan with monitoring for enterprise data warehouses (Oracle, SAP Hana, Teradata); offers multi‑workspace support for dev/test environments and integrations with ServiceNow and data catalogs.
Although the Monte Carlo team doesn’t disclose pricing on their website, G2 reviews and reddit users that used the platform say that the pricing is steep, especially for small teams.
Ecosystem and integrations
Monte Carlo integrates with 75 different tools across the data stack.
Their integration ecosystem includes:
- Data warehouses
- Orchestration tools
- Version control
- Collaboration channels
- AI models and orchestrators (OpenAI, Perplexity, Langchain, Hugging Face, and more)
- BI and notebooks
- Data catalogs
- Other data sources such as Salesforce
Integration depth varies. Some connectors rely on query logs, while others support full asset monitoring and lineage.
Customer reviews and considerations
On G2, Monte Carlo holds an average rating of 4.4 out of 5 stars from 436 reviews, with about 61 % five‑star and 35 % four‑star ratings.
Judging by user reviews, the average time to implement this data quality tool is ~2 months.
Positive sentiment
Users praise the automated monitoring, lineage visibility and ability to catch and resolve data issues before they impact stakeholders.
Many note that the platform provides low‑code/no‑code monitors and customisable monitors for SQL, and that customer support is responsive.
Reviewers also value a rich integration library.
Areas of concern
Some reviewers report that alerts can be noisy until thresholds are tuned, while others say that the UI for configuring monitors can feel cluttered.
A subset of reviews points to limited investigation tools, lack of Python support and a need for more transparency around the machine‑learning thresholds used for anomaly detection.
Pricing is a recurring concern; users note that the platform can be expensive for small teams and that additional connectors or features may incur extra cost.
Verdict
Monte Carlo sits at the high end of the data quality market. The platform’s ability to unify monitoring across warehouses, lakes, orchestration tools and BI platforms, along with a flexible deployment approach (SQL, UI or code), makes it appealing to firms with complex, mission‑critical data pipelines.
However, Monte Carlo is proprietary software with usage‑based pricing that may be expensive for smaller companies. Implementation takes time and tuning; some users find the UI cluttered,
For companies that value comprehensive observability, have large budgets, and are willing to invest time and resources into setup, Monte Carlo will be a leading choice, but smaller or cost‑conscious teams may want to evaluate lighter‑weight alternatives or open‑source testing frameworks.
Build the right enterprise data stack: Vodworks can help you align catalog, MDM, and policies for governed, high-quality data at scale. Schedule a consultation.
Ataccama ONE
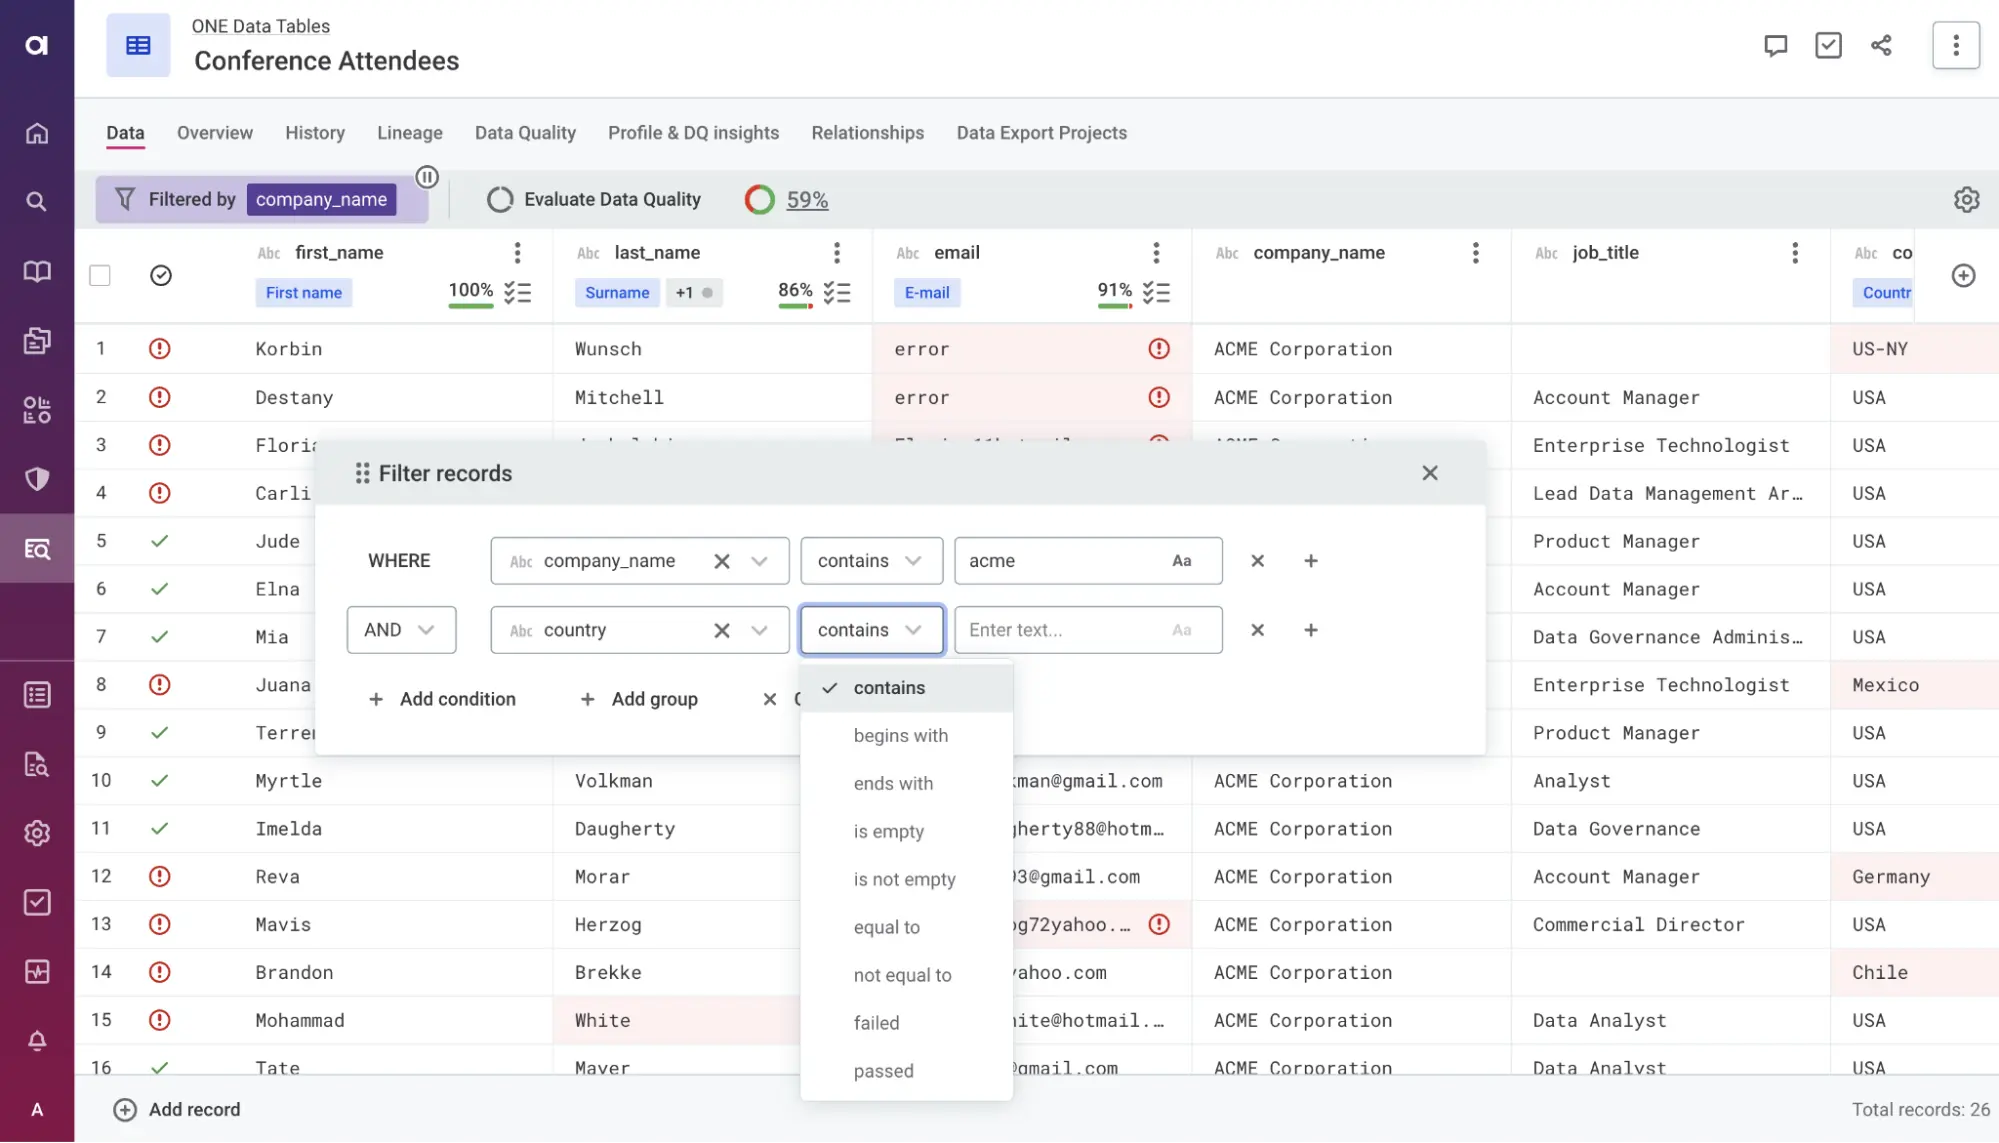 Ataccama ONE is a unified, AI-powered data management platform encompassing data quality, governance, and master data management. The platform has been on the market for 18 years, combining intelligent automation with end-to-end capabilities for profiling, cleansing, validation, and monitoring of enterprise data.
Firms use Ataccama to build a centralised data catalog, enforce data quality rules, prevent issues with automated checks, and trace data lineage for root cause analysis.
Key Strengths
- Comprehensive and AI-driven: Provides a full suite of data quality features (profiling, standardised rule library, anomaly detection, lineage, cleansing) under one platform, enhanced by advanced AI for automation .
- Scalability: Designed to manage data quality at scale across hybrid and multi-cloud environments, suitable for large enterprises with complex, distributed data landscapes.
- Integration and collaboration: Easily connects to various data sources and systems (databases, big data platforms, cloud storage) for broad coverage. It also supports collaboration between data teams via a unified interface, aligning data governance with quality management.
- Robust governance support: Features strong data governance integration (e.g. policy management and security controls) making it ideal for regulated industries requiring strict oversight.
Ideal use case
Ataccama ONE is best suited for large organisations that need an enterprise-wide data quality solution tightly integrated with data governance.
For companies in finance, healthcare, and other data intensive sectors with strict compliance needs, Ataccama’s combination of data cataloging, quality rules, and lineage offers a one-stop solution. It excels in environments where data is spread across multiple clouds or on-prem systems and where automation at scale is required to maintain quality.
Pricing Model
Ataccama ONE is a commercial software offered via enterprise subscription licensing. The platform doesn’t offer a free tier.
The platform’s pricing isn’t disclosed publicly and there’s no information on the website about how the price is formed or what plans does the platform offer.
Knowing that Ataccama ONE is an end-to-end data quality management platform for enterprise organisations, we can suggest that the platform comes at a premium price. This results from complicated deployment, support, and modularity of enterprise platforms.
Some third-party websites state that the price starts from $90,000 per year. However, there’s no way to verify whether that number is correct.
Also, Ataccama ONE can be self-hosted, so if looking for a data quality tool that can be deployed on-prem, you have to count in the hardware and maintenance costs.
Ecosystem and integrations
Ataccama ONE is a data source agnostic platform designed to integrate with the user’s entire data landscape.
Ataccama’s connector database lists 92 connectors, including various database management systems, ETL tools, BI systems, and more.
It also has APIs for custom integration and supports collaboration with tools like Jira for issue tracking.
Ataccama’s strong suit is working seamlessly in enterprise data pipelines. Additionally it supports integration with governance solutions and identity management to enforce policies. In short, it’s built to slot into complex enterprise data architectures without requiring a rip-and-replace of existing systems.
Customer reviews and considerations
On G2, Ataccama ONE holds an average rating of 4.2 out of 5.
Positive sentiment:
Customers praise the platform’s no-code architecture, unified approach, and versatile data handling capabilities.
Areas of concern:
However, a lot of reviews note that the platform has a steep learning curve. Some customers also think that the platform’s data quality module could use more features and that support requests could resolve faster.
Overall, clients view Ataccama as a powerful enterprise solution that “surpasses the competition” in capability , but they advise allocating time for training and possibly seeking Ataccama’s support services for a smooth implementation.
Verdict
Ataccama ONE is one of the top-tier data quality platforms for enterprises that need comprehensive features and are willing to invest in a large-scale solution. Its strength lies in breadth and automation, from profiling to cleansing to governance, all enhanced by AI.
This makes it an excellent choice for enterprise organisations with complex, multi-source data environments and strict governance requirements.
The trade-off is the high complexity and cost: Ataccama ONE is aimed at enterprises with established data teams, and the price will be too high for small teams.
If your data strategy demands an end-to-end, AI-augmented solution and you have the resources to support it, Ataccama ONE should be on your shortlist.
Unify observability across warehouses and BI, Vodworks configures monitors and alerting to cut noise and protect SLAs. Schedule a consultation.
Bigeye
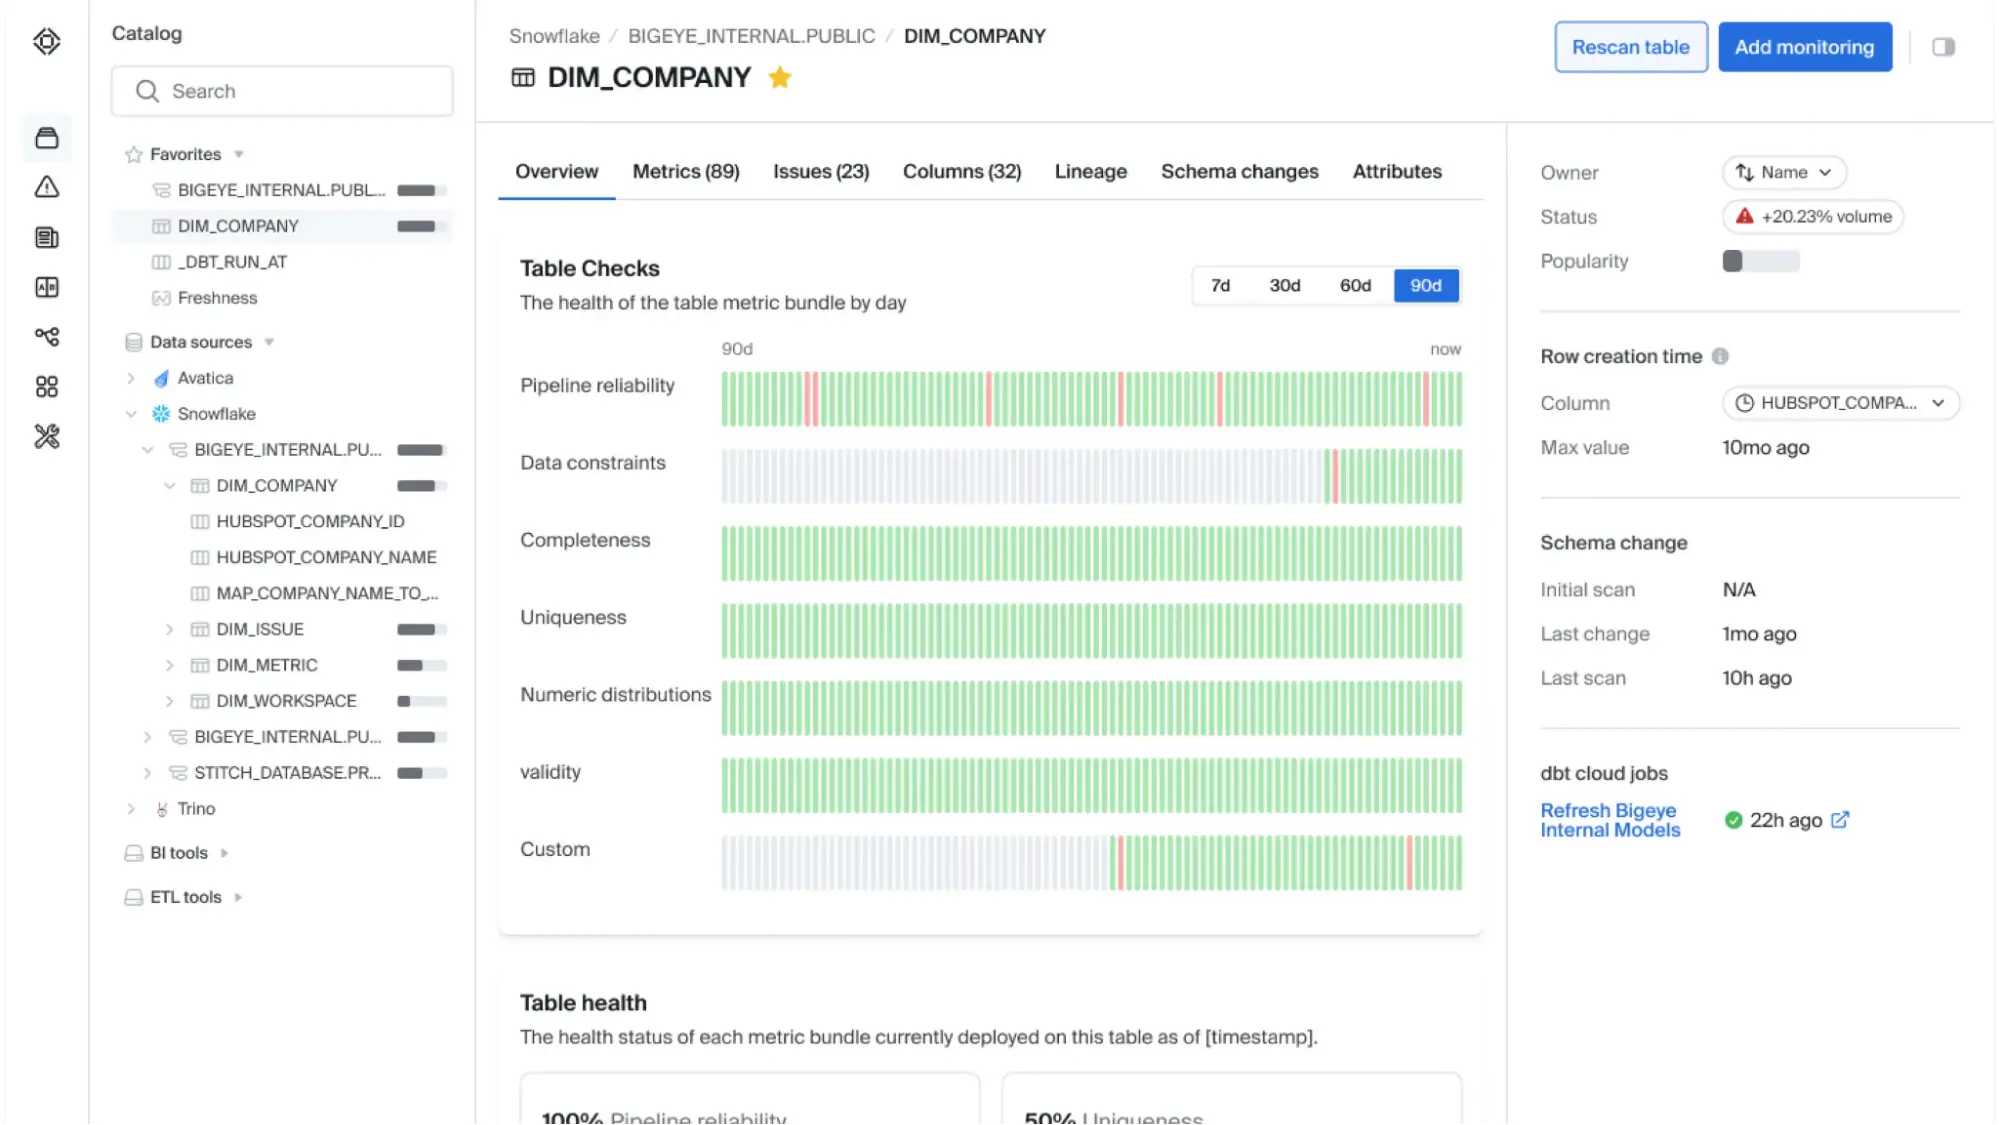 Bigeye is a data quality and observability tool designed to help data teams trust the data feeding their analytics and machine‑learning workloads.
It’s an enterprise‑grade platform that combines data lineage, anomaly detection, data quality rules, data reconciliation and incident management into a single platform to provide visibility into data pipeline performance and quality.
Instead of relying on manually written rules like traditional data‑quality tools, Bigeye uses dynamic metadata such as continuous data profiling and lineage to track data behaviour and detect both known and unknown issues across pipelines.
Key strengths
- Enterprise focus: It’s built for enterprise teams needing cloud, on‑premises or hybrid support and can monitor both modern and legacy data stacks. Customers include organisations such as USAA, Zoom, Hertz, Cisco and ConocoPhillips.
- Comprehensive observability features: Bigeye combines automated data quality monitoring, anomaly detection, root‑cause analysis and detailed data lineage/
Ideal use case
Bigeye is best suited to medium‑to‑large enterprises with complex data pipelines who need proactive monitoring across multiple data platforms.
The platform is particularly valuable when data pipelines span multiple storage engines ( (cloud data warehouses, databases, on‑premises systems) and manual rule writing takes too much time and effort.
This data quality tool also comes in handy for organisations requiring end‑to‑end lineage for root‑cause analysis. Bigeye’s capabilities help data engineers understand dependencies and quickly identify where a problem originated.
Pricing model
Bigeye’s pricing is not publicly available. The final price is custom and varies on the client’s requirements and usage.
G2 lists an Enterprise Starter edition with features such as end‑to‑end lineage, cloud/on‑prem/hybrid support, cross‑source columnar mapping, automated dependency monitoring, 70+ pre‑built data quality checks and AI‑driven anomaly detection.
Third-party sources claim that Bigeye’s pricing depends on the volume of data monitored.
To get a precise pricing quote, potential customers need to contact Bigeye’s sales team.
Ecosystem and integrations
Bigeye integrates with over 50 different technologies of the modern data stack, and has 7 more integrations in their roadmap:
- Data sources and warehouses: Connectors for Snowflake, Amazon Redshift, Google BigQuery, Databricks and numerous relational databases (PostgreSQL, MySQL, Oracle, SQL Server, Teradata and others) .
- ETL and orchestration tools: Integration with Airflow and dbt for scheduling and transformation pipelines .
- Data catalogues: Connectors to popular catalogues such as Alation, Atlan and data.world
- Business intelligence/visualisation tools: BI integration with Tableau, Looker and Power BI
- Notification systems: Incident management integrations allow alerts via Slack, email, Microsoft Teams, webhooks, Jira and ServiceNow.
Customer reviews and considerations
On G2, Bigeye has an average score of 4.1 out of 5 stars based on 22 reviews. The platform is rated highly for real‑time monitoring and anomaly detection, but users note areas for improvement and cost considerations.
Positive sentiment
Reviewers appreciate that Bigeye’s concepts are easy to understand yet offer technical depth, and they like that the system automates freshness and volume checks and supports custom checks via SQL.
The platform helps detect latency, freshness issues, row‑count shifts and distributional changes, and displays lineage for impacted tables during incidents . Reviewers note that these capabilities help identify and resolve data pipeline issues quickly and support downstream departments’ KPIs.
Areas of concern
Some users are waiting for integrations specific to their tech stacks and mention missing or incomplete features.
Also, for users without SQL knowledge, some features are less intuitive, and the learning curve can be steep.
Finally, cost is a recurring concern; reviewers mention that Bigeye has a steep pricing and may be expensive for smaller organisations.
Verdict
Bigeye stands out as an enterprise‑focused data quality solution that combines data lineage, anomaly detection, monitoring and incident management in one system. It’s well suited to enterprises that require robust observability across diverse data ecosystems and are willing to invest in a premium solution.
SAS Data Quality
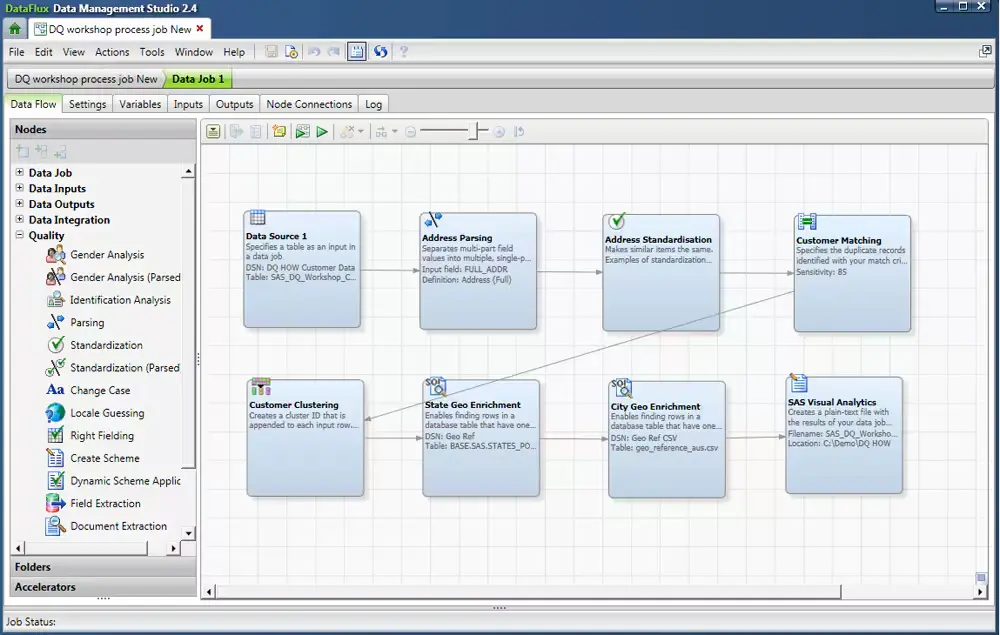
SAS, a long-time leader in analytics, also offers strong data quality capabilities through its SAS Data Quality solution.
SAS Data Quality provides tools for data profiling, parsing, normalisation, matching, and monitoring, all integrated with SAS’s analytics platform
Because SAS is an analytics company, the data quality tools also integrate with statistical techniques and the broader SAS ecosystem (for example, you can apply data quality transformations as part of data prep for analytics). SAS Data Quality emphasises “knowledge-based” quality, meaning it leverages dictionaries, lexicons, and algorithms to understand context in data. This makes it powerful for cleaning diverse datasets.
Key strengths
- Strong data profiling and monitoring: SAS offers robust data profiling tools, generating frequency distributions, pattern analyses, and outlier detection on columns. Additionally, SAS Data Quality can set up ongoing data monitoring, with dashboards and reports to track data quality KPIs
- Advanced customisation with code: Under the hood, SAS Data Quality allows advanced users to write custom logic using SAS’s programming language or DataFlux expression language. If a built-in transformation doesn’t meet your needs, you can script something very specific.
- Excellent documentation and support: SAS has a reputation for thorough documentation and a strong support network (including SAS consultants and user community). Enterprise users often mention that SAS’s documentation is excellent, which shortens the learning curve for its data quality tools.
Ideal use case
SAS Data Quality is a great fit for organisations that are already invested in SAS technologies. For example, a healthcare company using SAS for clinical data analysis can use SAS Data Quality to clean patient records (e.g., resolve duplicate patient entries, standardise diagnosis codes) before analysis.
Companies with heavy data governance programs will benefit from SAS’s ability to profile and monitor data quality as part of a controlled process (with audit trails, etc.).
SAS Data Quality is industry-agnostic but finds particular use in banking (customer and transaction data cleaning), healthcare (patient and claims data standardisation), government (data integration across departments), and similar fields where data accuracy and consistency are paramount and SAS is frequently the analytics tool of choice.
Pricing Model
SAS does not publish a simple price list, as costs vary widely based on configuration. A full-scale enterprise implementation can cost over a million US dollars, based on the number of users, level of support required, and additional modules included in the package.
Expect to engage SAS for a custom quote. The company may offer a pilot or a limited-term license for evaluation, and discounts are often negotiable, especially if bundling with other SAS products.
Ecosystem and integrations
The SAS Data Quality solution integrates best with the SAS ecosystem. It works within SAS Data Management Studio/DataFlux: you can create data jobs and quality jobs that can be executed as part of SAS ETL flows or called from SAS programs.
SAS DataFlux Quality Server can expose data quality services (like a real-time address verification or data cleansing service) via SOAP/REST.
SAS also connects to many databases (Oracle, SQL Server, DB2, etc.), big data sources (Hadoop, if using SAS Access to Hadoop), and flat files (CSV, Excel).
Customer reviews and considerations
G2 ratings give SAS Data Quality an overall 4.0 out of 5 score, based on 67 reviews. Among reviewers, with 41% of reviewers giving it five stars and 44% rating it at four stars.
Positive sentiment:
On the upside, users often highlight its robust data cleansing/standardisation capabilities and integration strengths. Several reviews call out effective tools for cleaning and preparing data, citing SAS Data Flux Studio/Viya components, and note that it’s “easy to maintain” once set up.
Areas of concern:
As for drawbacks, common themes include a steep learning curve (some even label it “not user-friendly”), along with concerns about cost and occasional integration challenges or resource demands on large workloads.
Overall, buyers on G2 see SAS Data Quality as a powerful, enterprise-grade option for improving data quality at scale, especially if you can accommodate the learning time and budget.
Verdict
If you’re already a SAS customer, adding Data Quality is an easy win: it extends your existing stack, handles everything from quick fixes to complex entity resolution, and leverages SAS’s analytics (e.g., profiling statistics) to drive measurable quality improvements.
If you’re not in a highly regulated industry, and you’re not already on SAS, the trade-offs are tougher. Implementation typically requires significant time and resources for environment setup, team enablement, and migrating data assets into the SAS ecosystem.
As always, it comes down to alignment: SAS Data Quality fits perfectly for a certain class of organisations, if you’re among them, it’s a proven choice that will likely serve you excellently. If not, there are plenty of strong alternatives worth considering.
OpenMetadata
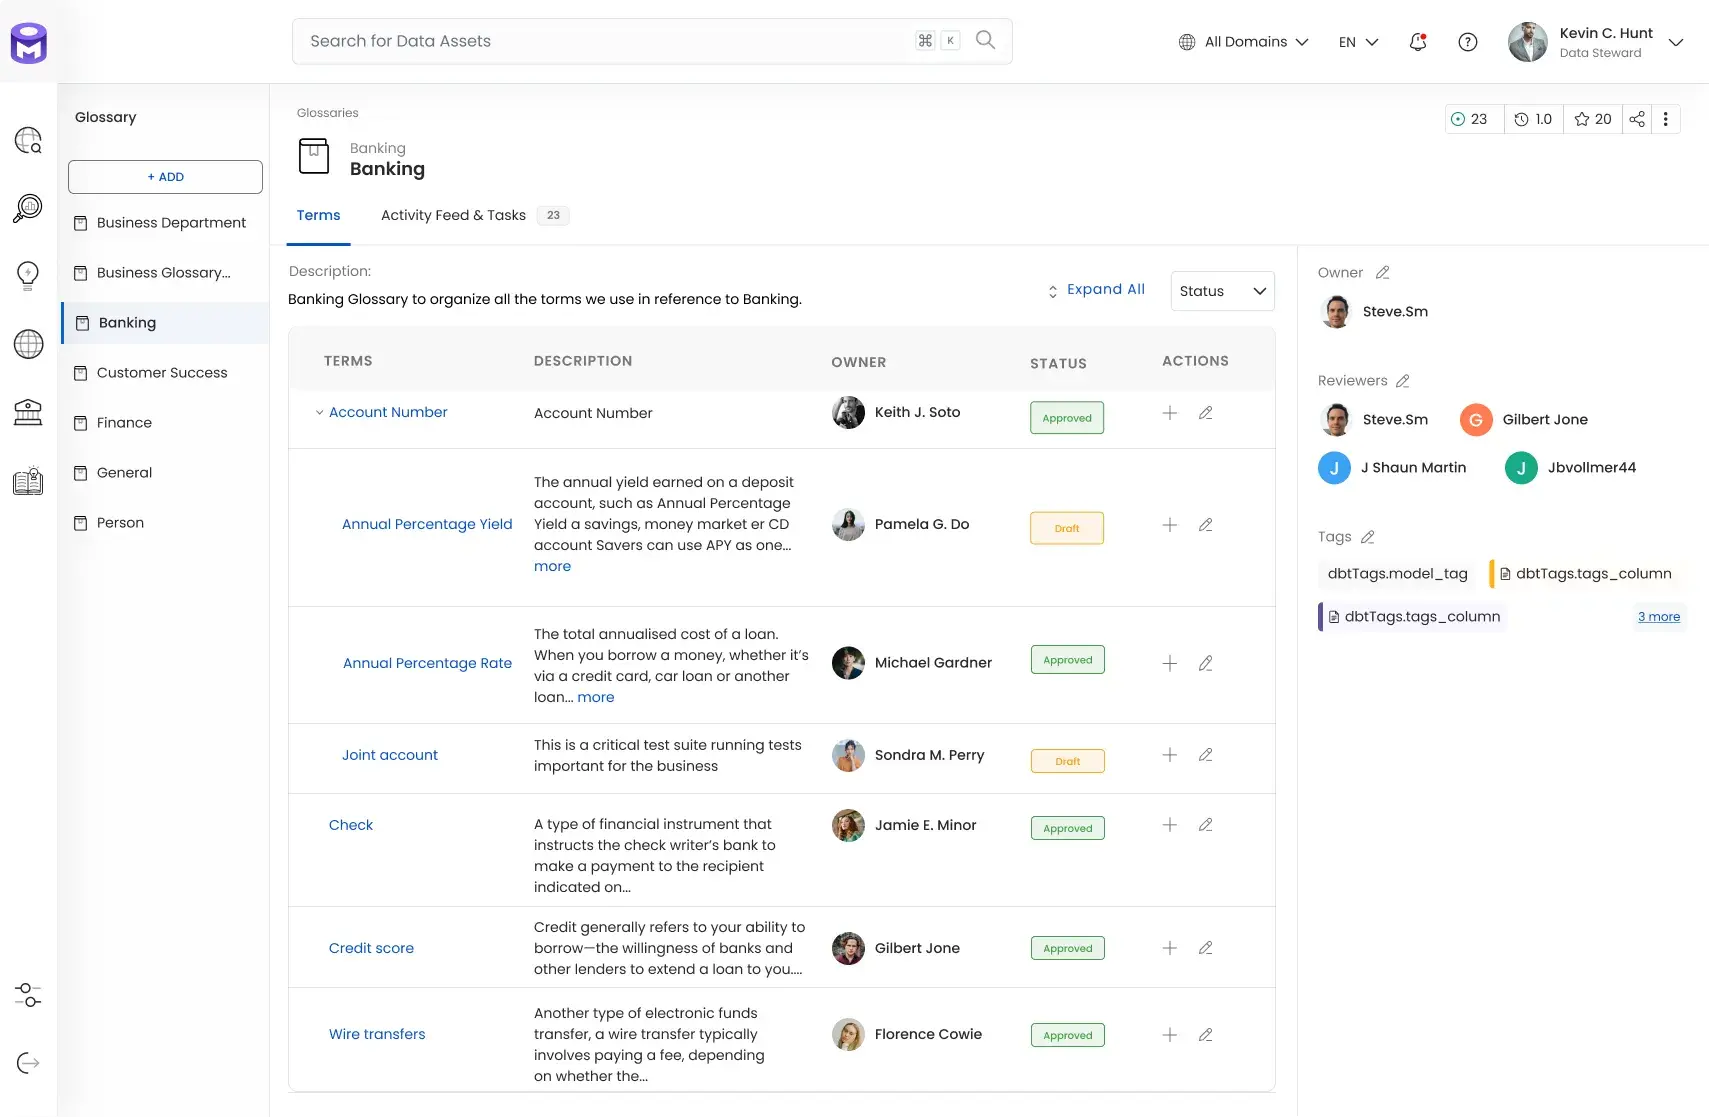
OpenMetadata is an open‑source platform for centralising metadata for data discovery, lineage, quality, observability, governance and team collaboration.
The project positions itself as a unified metadata platform, a single place where data producers and consumers can manage data assets at scale. OpenMetadata’s unified metadata graph stores the relationships between tables, columns, dashboards, pipelines and ML models and exposes them through well‑defined REST and GraphQL APIs.
Key strengths
- Unified metadata graph and API‑first design: OpenMetadata centralises technical, operational and social metadata in a graph and offers REST/GraphQL APIs that allow developers to ingest and query metadata programmatically. The API‑first, schema‑first approach lets teams extend the model with custom entities and relationships.
- Broad connector ecosystem: The platform provides more than 100 connectors for databases, data lakes, messaging systems, pipelines, dashboards and ML models.
- Native data quality and observability: OpenMetadata includes a data profiler and a no‑code data quality framework. Users can define table‑level and column‑level tests to check completeness, freshness and accuracy, configure alerting on failures, track test results on a health dashboard and manage resolution workflows.
Ideal use case
OpenMetadata is attractive for organisations that want an open‑source, vendor‑agnostic metadata platform and have the technical resources to deploy and maintain it.
It suits teams that need unified discovery, lineage and data quality without vendor lock‑in. With a free Apache 2.0 licence and modular APIs, OpenMetadata enables teams to build a metadata catalog tailored to their stack.
This data quality tool requires an engineering capacity to manage infrastructure. The project is built by and for data engineers, so the UI and operations are oriented towards technical users.
Pricing model
Open source edition. The core OpenMetadata platform is released under the Apache 2.0 licence and is free to download and self‑host. The project’s end‑to‑end lineage and data catalog functions are therefore available without licence fees . However, organisations must budget for deployment and maintenance costs.
Collate managed service. Collate, the company behind OpenMetadata, offers a SaaS version with additional features, support and AI tools. The pricing page describes three tiers:
- Free tier. Includes 5 users, 500 data assets, unlimited connectors. Runs as a multi-tenant SaaS.
- Premium. Designed for teams/small businesses with 25 users and 5,000 data assets. Adds automated PII classification and SSO integration; can deploy as single‑tenant or hybrid SaaS. Collate doesn’t publish a price, however discussions claim that the starting price is about $10,000 per year or $1,000 per month.
- Enterprise. Unlimited users and data assets, custom integrations, dedicated support. Pricing is custom and requires contacting sales.
The Collate pricing page also advertises AI agents (AskCollate, Documentation Agent, AutoPilot, Tiering Agent and Quality Agent) as optional additions.
Ecosystem and integrations
OpenMetadata’s ingestion framework supports connectors across multiple categories:
- Databases (PostgreSQL, MySQL, Oracle, etc.)
- Messaging/Streaming (Kafka, Redpanda, NiFi)
- ETL/Orchestration ( Airflow, Dagster, Fivetran, dbt, Prefect)
- Dashboards/BI (Looker, Tableau, Power BI, Metabase, Grafana, Superset)
- ML/Analytics (MLflow, SageMaker, MLOps pipelines)
- Other services (Salesforce, SAP, AWS S3, GCS, ADLS, Elasticsearch, OpenSearch etc)
OpenMetadata’s data quality module integrates with Great Expectations and dbt to leverage existing test suites.
Collate’s paid tiers provide no‑code data quality configuration and scheduled test runs.
For collaboration, OpenMetadata supports Slack and Microsoft Teams for notifications.
Customer reviews and considerations
Independent review websites such as G2 lack reviews or sufficient data, that’s why we consulted community forums to find reviews from people with hands-on experience.
Positive sentiment
Some users highlight the tool’s simple architecture (uses MySQL/Postgres, Elastic/OpenSearch and a scheduler), large number of connectors and unified platform for data discovery, quality and governance.
Another commenter reported that the “team is amazing,” praising the responsive community and helpful Slack support.
Users appreciate that the platform combines cataloging, lineage and data quality in one tool and that it is easier to deploy than alternatives such as DataHub.
Areas of concern
One data engineer noted that while OpenMetadata works well for common databases, it struggles with modern lakehouse architectures.
Verdict
OpenMetadata is a powerful open‑source framework for unifying data discovery, lineage, quality and governance.
Its unified metadata graph, broad connector ecosystem and native data quality engine make it one of the most feature‑rich open‑source metadata platforms.
For engineering‑driven organisations seeking flexibility and freedom from vendor lock‑in OpenMetadata can serve as the backbone of a modern data governance stack.
Vodworks AI Readiness Package: Your Fast Lane to Trusted Data Foundations
Vodworks can help you design quality at the source, make data health traceable, and centralise data from disparate sources in a storage of your choice.
We start by assessing your current state of data quality, structure, storage, governance, and compliance, then map a targeted path to a single source of truth and observable, reliable pipelines.
From there, we design the data strategy and architecture, implement ingestion, transformation, and enrichment with built-in validation and monitoring, and reinforce it with access controls, audit trails, and policy-as-code governance.
Our engineers operationalise the stack so quality holds up in production and reporting, with MLOps applied to maintain reliable models and analytics.
Book a 30-minute discovery call with a Vodworks solution architect to review your data estate and discuss your data use cases.

About the Author
Abdul Qayyum
With more than 17 years in software development, Abdul is a Software Architect has extensive expertise in Java, Big Data, AI/ML, and Blockchain technologies. His main role is to deliver strong architecture for back-end and middleware solutions to our clients across diverse business domains, including Telco, E-commerce, Blockchain, Media Streaming, Social Apps, and IoT.


Accelerate Your Projects With Our On-Demand Developers
Let's TalkTalent Shortage Holding You Back? Scale Fast With Us
Frequently Asked Questions
How do you handle different time zones?

With a team of 150+ expert developers situated across 5 Global Development Centers and 10+ countries, we seamlessly navigate diverse timezones. This gives us the flexibility to support clients efficiently, aligning with their unique schedules and preferred work styles. No matter the timezone, we ensure that our services meet the specific needs and expectations of the project, fostering a collaborative and responsive partnership.
What levels of support do you offer?
We provide comprehensive technical assistance for applications, providing Level 2 and Level 3 support. Within our services, we continuously oversee your applications 24/7, establishing alerts and triggers at vulnerable points to promptly resolve emerging issues. Our team of experts assumes responsibility for alarm management, overseas fundamental technical tasks such as server management, and takes an active role in application development to address security fixes within specified SLAs to ensure support for your operations. In addition, we provide flexible warranty periods on the completion of your project, ensuring ongoing support and satisfaction with our delivered solutions.
Who owns the IP of my application code/will I own the source code?
As our client, you retain full ownership of the source code, ensuring that you have the autonomy and control over your intellectual property throughout and beyond the development process.
How do you manage and accommodate change requests in software development?
We seamlessly handle and accommodate change requests in our software development process through our adoption of the Agile methodology. We use flexible approaches that best align with each unique project and the client's working style. With a commitment to adaptability, our dedicated team is structured to be highly flexible, ensuring that change requests are efficiently managed, integrated, and implemented without compromising the quality of deliverables.
What is the estimated timeline for creating a Minimum Viable Product (MVP)?
The timeline for creating a Minimum Viable Product (MVP) can vary significantly depending on the complexity of the product and the specific requirements of the project. In total, the timeline for creating an MVP can range from around 3 to 9 months, including such stages as Planning, Market Research, Design, Development, Testing, Feedback and Launch.
Do you provide Proof of Concepts (PoCs) during software development?
Yes, we offer Proof of Concepts (PoCs) as part of our software development services. With a proven track record of assisting over 70 companies, our team has successfully built PoCs that have secured initial funding of $10Mn+. Our team helps business owners and units validate their idea, rapidly building a solution you can show in hand. From visual to functional prototypes, we help explore new opportunities with confidence.
Are we able to vet the developers before we take them on-board?
When augmenting your team with our developers, you have the ability to meticulously vet candidates before onboarding. We ask clients to provide us with a required developer’s profile with needed skills and tech knowledge to guarantee our staff possess the expertise needed to contribute effectively to your software development projects. You have the flexibility to conduct interviews, and assess both developers’ soft skills and hard skills, ensuring a seamless alignment with your project requirements.
Is on-demand developer availability among your offerings in software development?
We provide you with on-demand engineers whether you need additional resources for ongoing projects or specific expertise, without the overhead or complication of traditional hiring processes within our staff augmentation service.
Do you collaborate with startups for software development projects?
Yes, our expert team collaborates closely with startups, helping them navigate the technical landscape, build scalable and market-ready software, and bring their vision to life.
Our startup software development services & solutions:
- MVP & Rapid POC's
- Investment & Incubation
- Mobile & Web App Development
- Team Augmentation
- Project Rescue
Subscribe to our blog
Related Posts
Get in Touch with us
Thank You!
Thank you for contacting us, we will get back to you as soon as possible.
Our Next Steps
- Our team reaches out to you within one business day
- We begin with an initial conversation to understand your needs
- Our analysts and developers evaluate the scope and propose a path forward
- We initiate the project, working towards successful software delivery